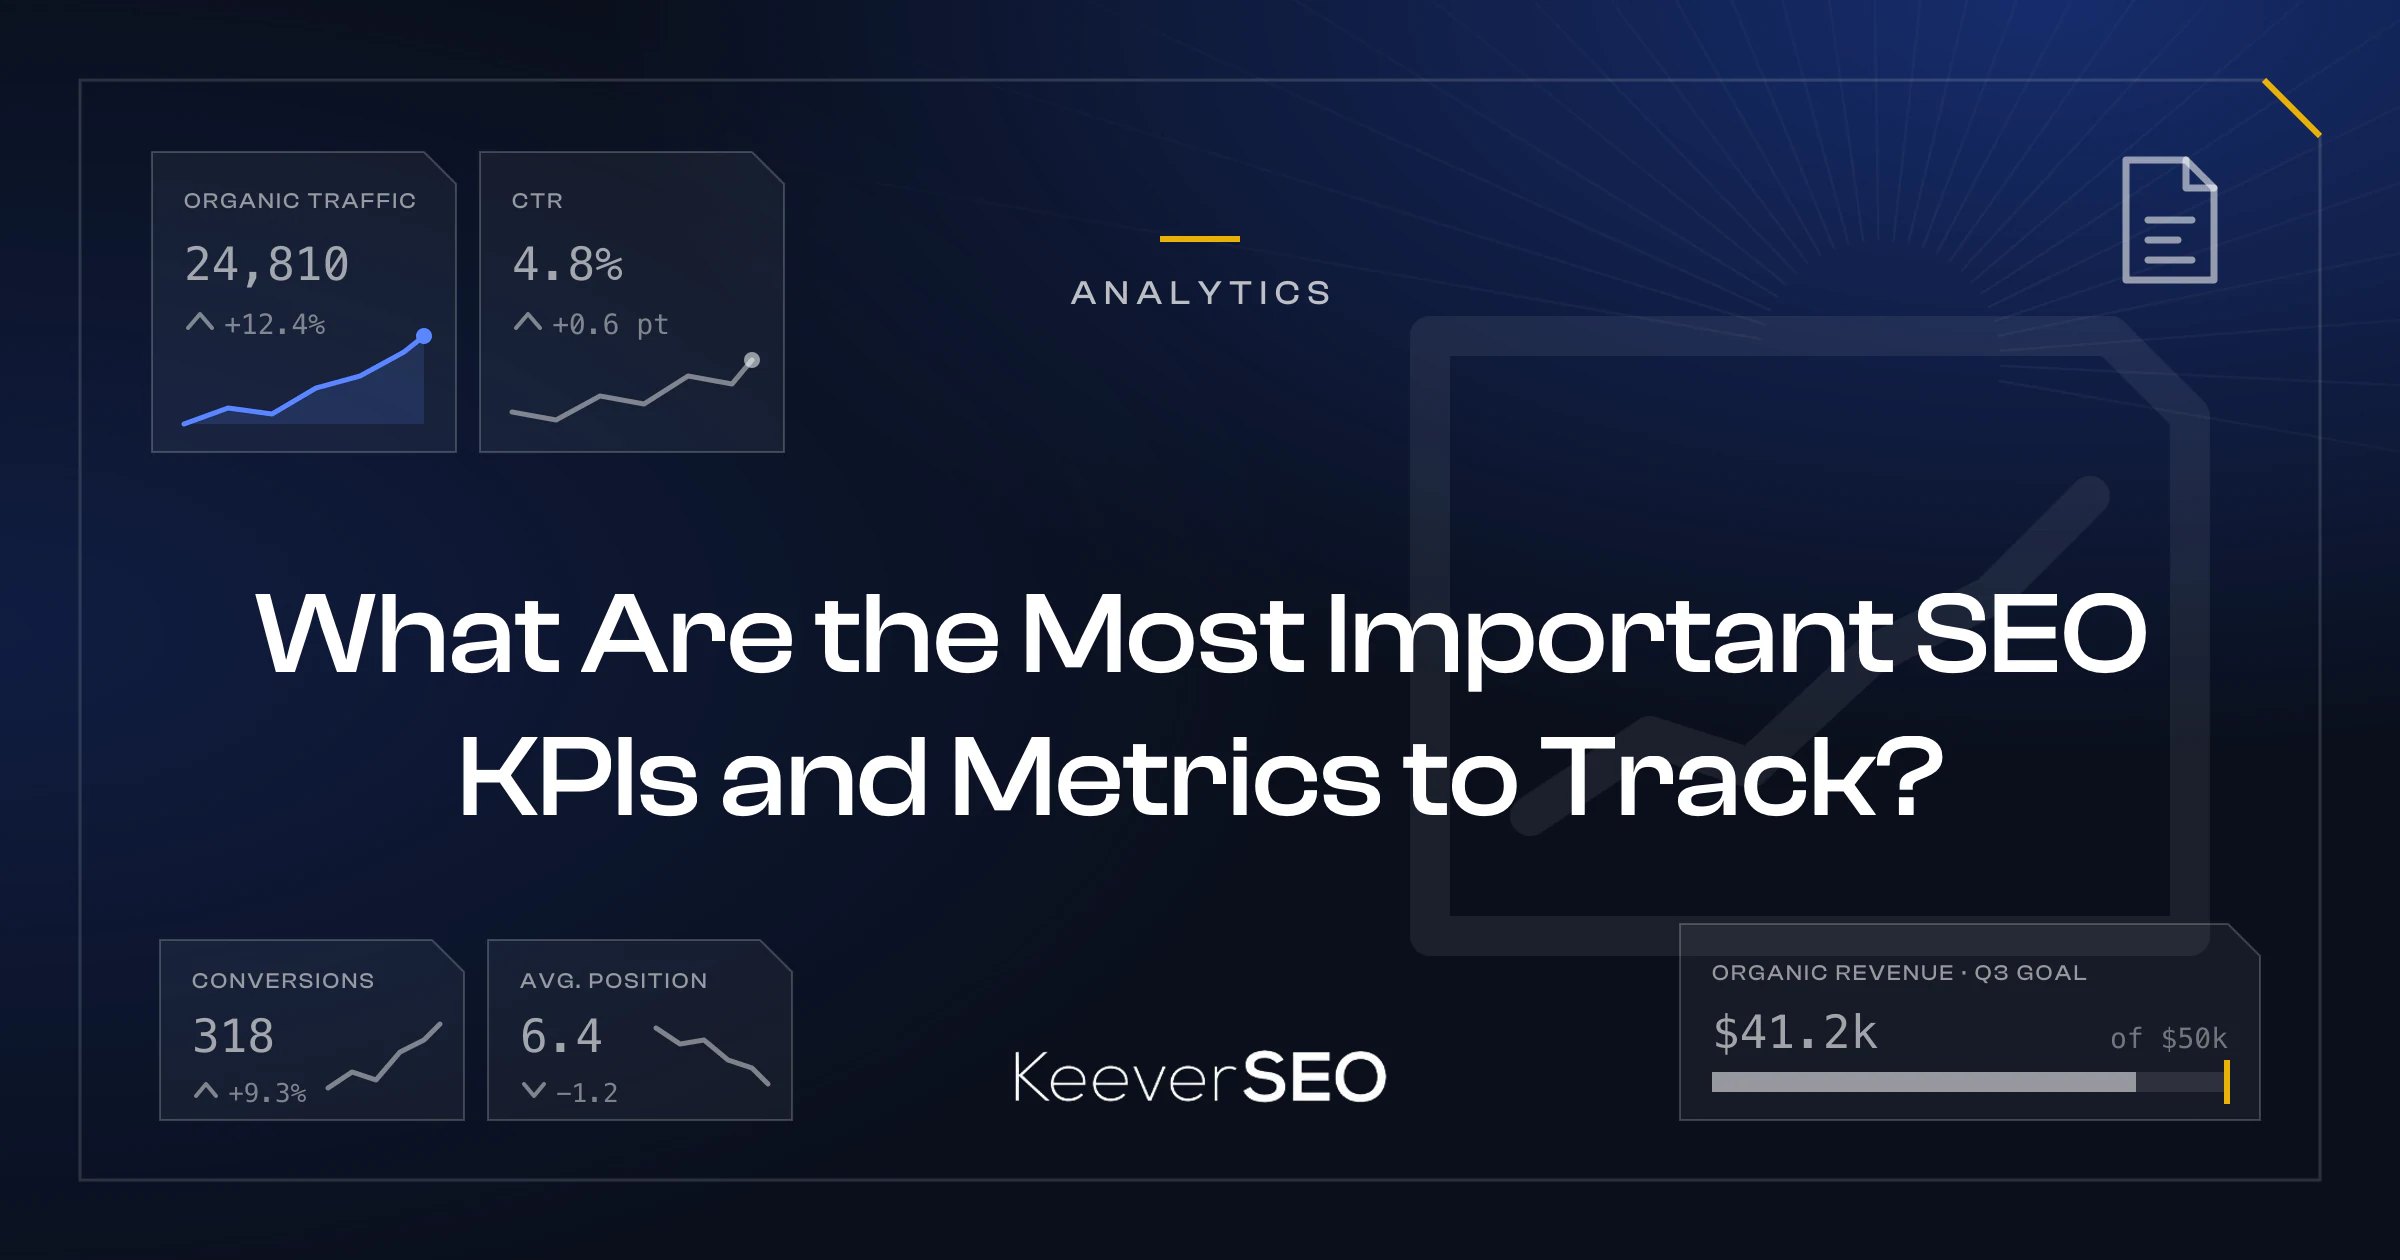
The most important SEO KPIs to track are organic traffic, keyword visibility, conversions, and revenue with return on investment. Organic traffic, keyword visibility, conversions, and revenue form a small, goal-tied core that drives business outcomes, while dozens of other trackable metrics sit underneath as diagnostic signals. An SEO KPI (key performance indicator) is a measurable value that evaluates progress toward a defined SEO and business objective, and a KPI differs from a raw SEO metric because the KPI is the deliberately selected, business-tied subset monitored against a target.
The KPI categories below form a flowing chain of SEO measurement: organic traffic and non-branded traffic, search-performance metrics and click-through rate, keyword visibility and rankings, landing-page and engagement metrics, conversions, revenue and profitability, technical SEO and Core Web Vitals, backlink authority, and SERP and Google Business Profile visibility. The same KPIs are segmented by who needs them, since SMB, local, e-commerce, SaaS, and enterprise businesses each prioritize a different KPI core, and by audience role, from executives who watch revenue to technical teams who watch site health.
SEO KPIs are reviewed monthly with quarterly benchmarking to account for the multi-month lag before SEO changes surface in the data, and targets are set from historical data with industry benchmarks used as cautious reference points rather than absolutes. KPI data is validated by reconciling attribution gaps between Google Analytics 4 and Google Search Console so that reported numbers can be trusted.
An SEO KPI dashboard combines dedicated widgets and data sources for traffic, visibility, conversions, revenue, technical health, and backlinks rather than relying on one tool. An SEO agency's KPI reporting should deliver context and causation behind every number, ownership of results, and real-time dashboard access, and the hiring questions to ask cover which KPIs the agency reports, its reporting cadence, its attribution method, dashboard access, and how the agency explains KPI changes. After hiring, the same goal-tied core of organic traffic, keyword visibility, conversions, revenue, and technical health keeps agency accountability anchored to real outcomes, starting with a precise definition of what SEO KPIs are.
What are SEO KPIs?
SEO KPIs (key performance indicators) are measurable values that assess how well search engine optimization efforts achieve defined business goals. An SEO KPI belongs to a goal-tied subset of metrics chosen for a direct connection to business outcomes, such as organic traffic, keyword visibility, conversion performance, and revenue impact. Each indicator shows how closely SEO strategy aligns with broader business objectives.
The primary tools for measuring SEO KPIs are Google Analytics 4 (GA4) and Google Search Console. Google Analytics 4 tracks user behavior, sessions, and conversions, while Google Search Console reports search impressions, clicks, and average position. Both platforms supply the raw data from which goal-tied KPIs are extracted.
The distinction between an SEO KPI and a raw SEO metric decides which numbers deserve a target, a review cadence, and a place in the reporting framework.
How do SEO KPIs differ from SEO metrics?
SEO KPIs differ from SEO metrics in purpose and application. SEO metrics are raw data points that record activity, such as total impressions, page load times, and individual keyword positions. SEO KPIs are the metrics singled out for direct alignment with a business goal, such as revenue growth or lead generation.
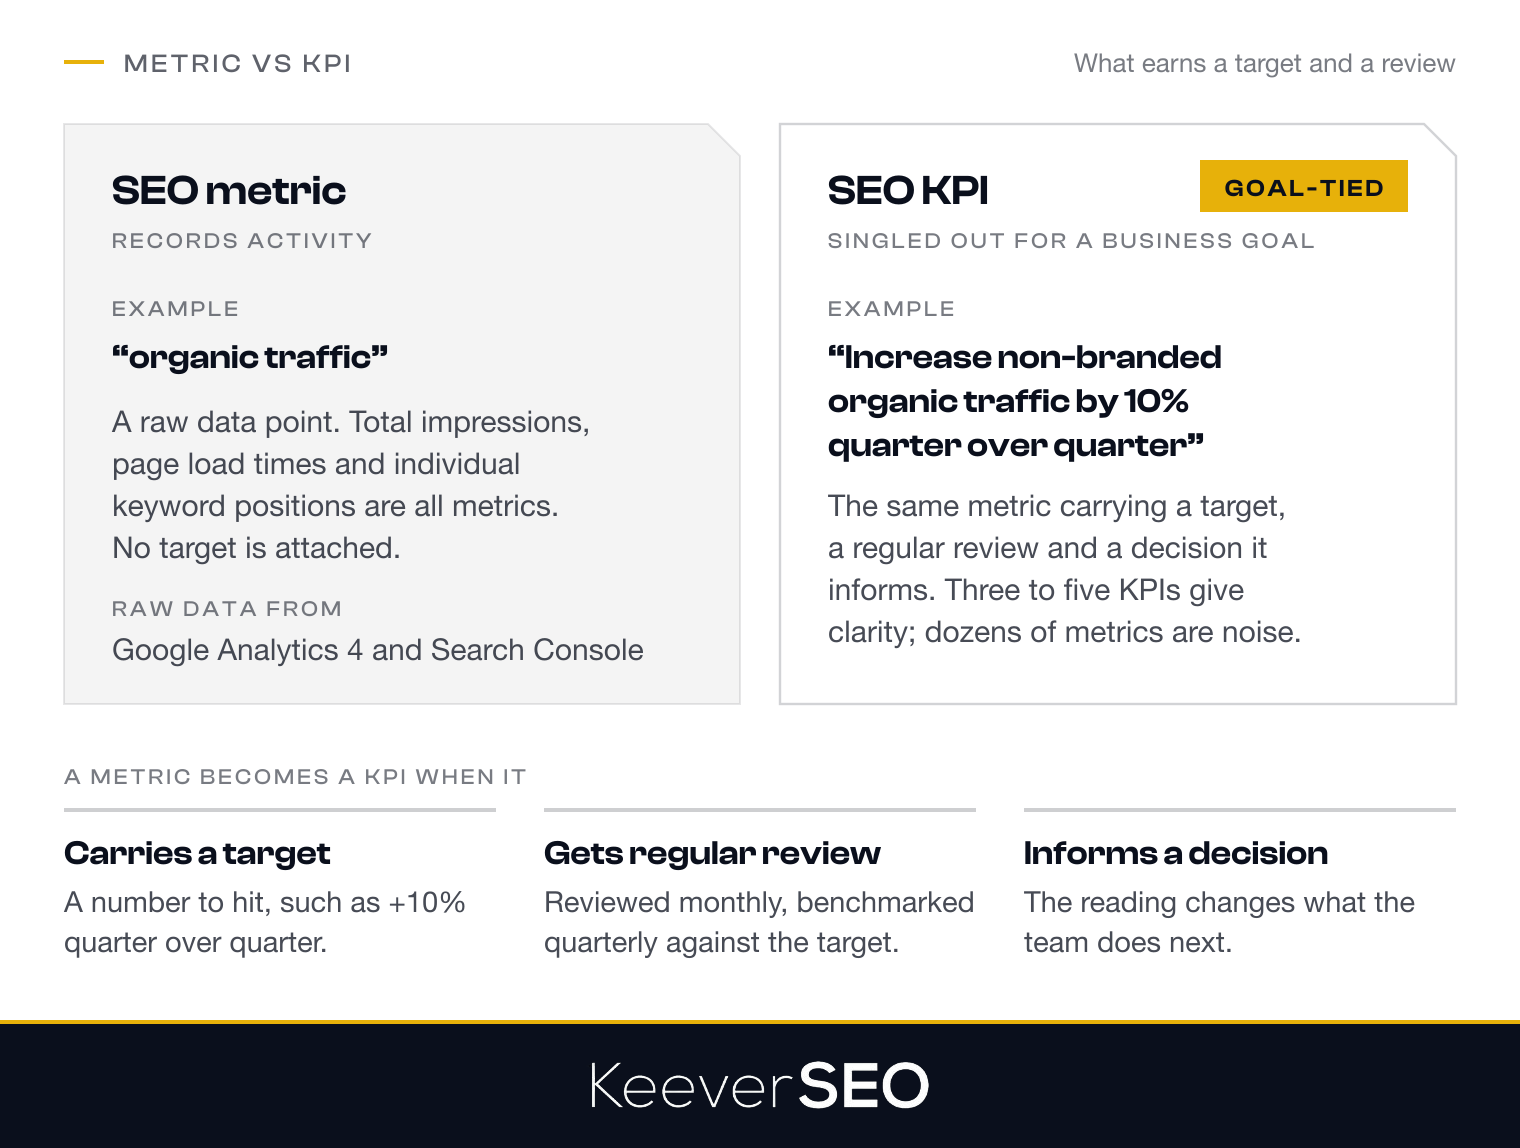
A metric becomes a KPI when the metric carries a target, receives regular review, and informs a decision. For instance, "organic traffic" is a metric, while "increase non-branded organic traffic by 10% quarter over quarter" is a KPI.
Tracking dozens of metrics creates noise, while three to five goal-aligned KPIs give clarity on performance and business impact. The KPI-versus-metric distinction is the filter for deciding which performance indicators deserve tracking in the first place.
What types of SEO KPIs and metrics should you track?
The types of SEO KPIs and metrics worth tracking fall into the categories listed below:
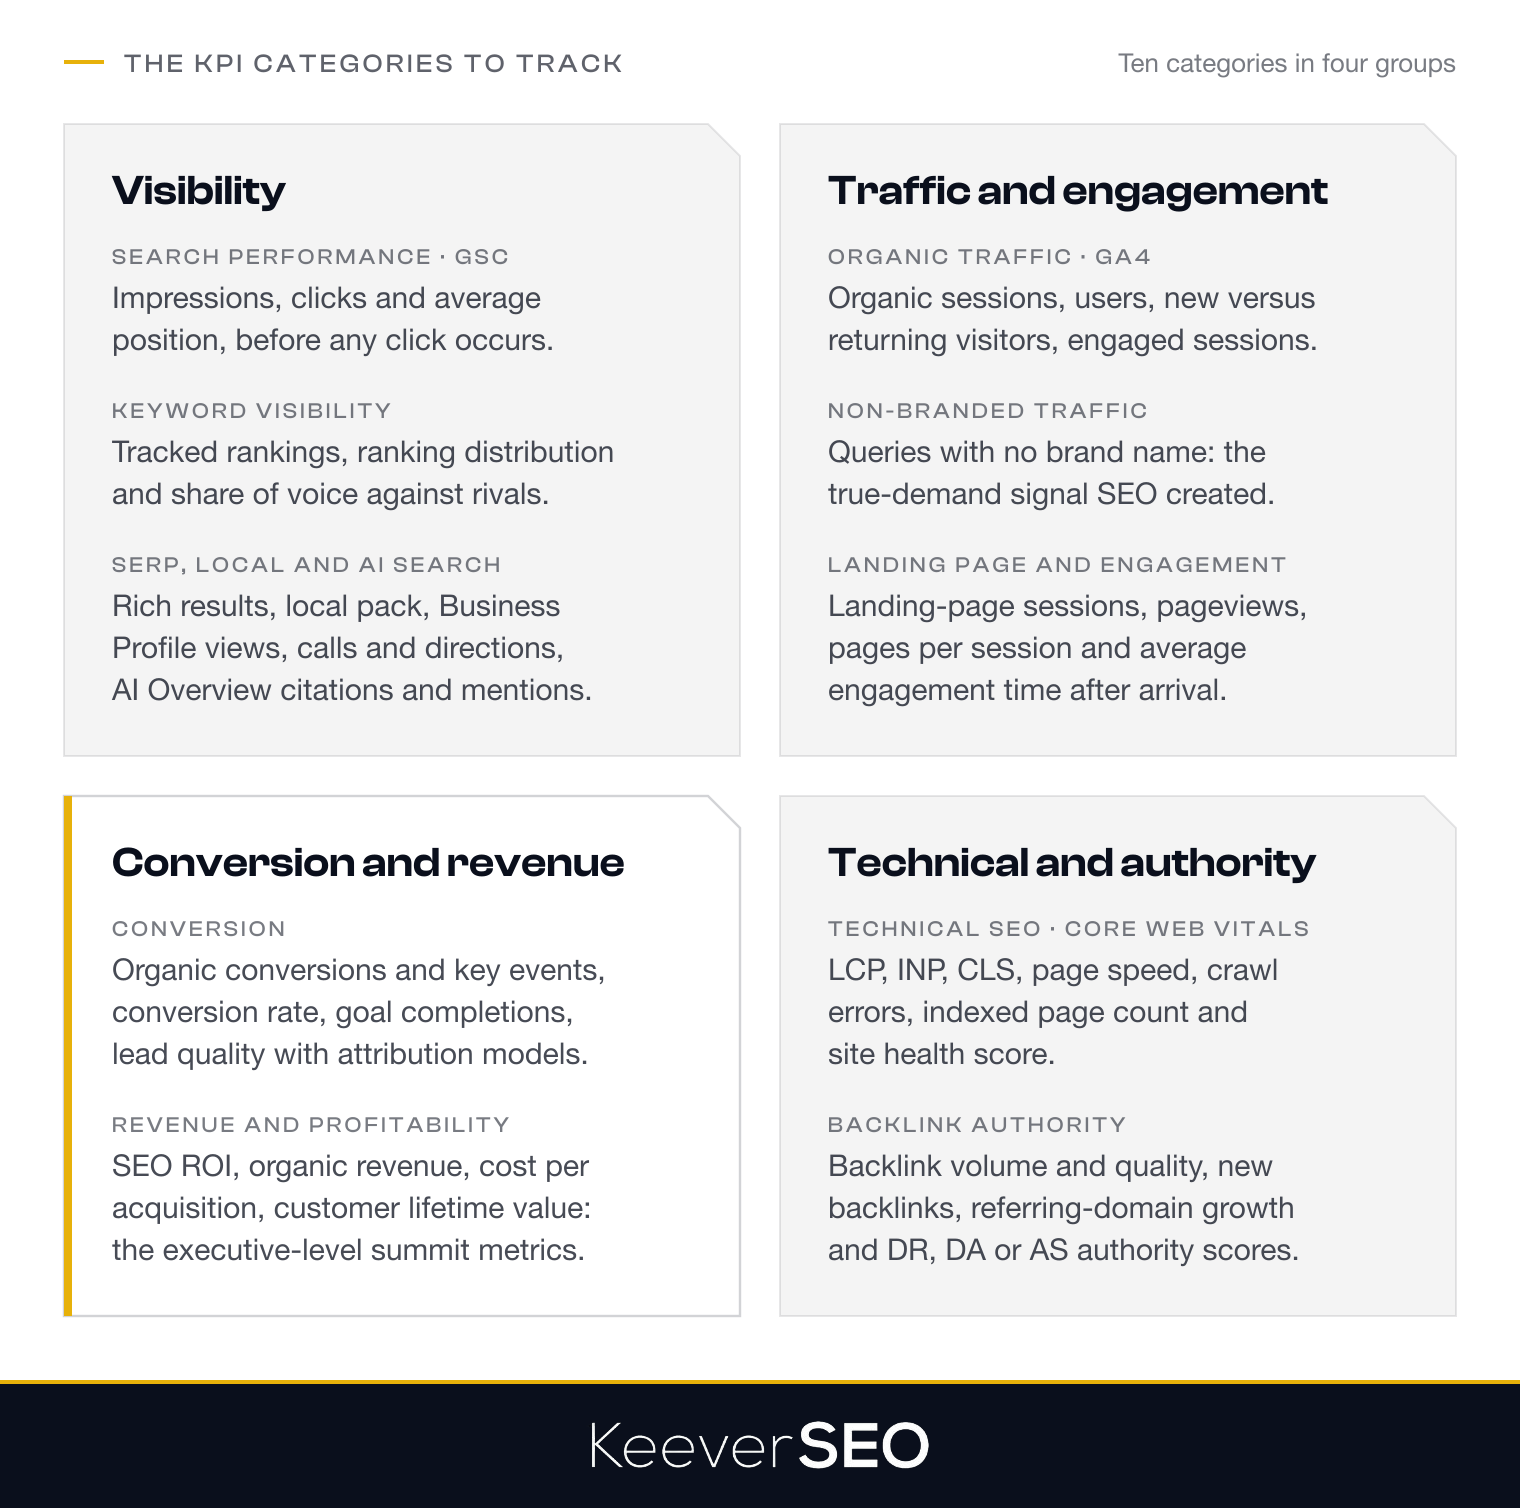
- Organic traffic KPIs: organic sessions, users, new versus returning visitors, and engaged sessions, which measure the volume and quality of visitors arriving from search engines.
- Search-performance metrics: impressions, clicks, and average position from Google Search Console, which capture visibility in search results before any click occurs.
- Keyword-visibility KPIs: tracked keyword rankings, ranking distribution, and share of voice against competitors, which measure competitive standing across the target keyword set.
- Landing-page and engagement metrics: landing-page performance, pageviews, pages per session, average engagement time, and top-performing pages, which reveal how users interact with organic content after arrival.
- Conversion KPIs: organic conversions, key events, conversion rate, and lead quality through multi-touch attribution, which connect search traffic to business actions.
- Revenue and profitability KPIs: SEO ROI, organic revenue, cost per acquisition, and customer lifetime value, which form the executive-level summit metrics.
- Technical SEO and Core Web Vitals KPIs: Largest Contentful Paint (LCP), Interaction to Next Paint (INP), Cumulative Layout Shift (CLS), page speed, crawlability, crawl errors, indexed page count, and site health scores, which assess site health and user experience.
- Backlink authority KPIs: backlink volume and quality, new backlinks, referring-domain growth, and third-party authority scores (DR, DA, AS), which measure credibility signals from the wider web.
- SERP and local visibility metrics: SERP feature and rich-result presence, local pack rankings, and Google Business Profile views, calls, and direction requests, which matter most for businesses with physical locations or local service areas.
- Non-branded organic traffic: a standalone traffic metric that filters out searches containing the brand name and acts as the true-demand signal separating SEO value from existing brand awareness.
- AI-powered search visibility: AI Overview visibility, AI citations, AI mentions, and AI referral traffic, an emerging 2026 category as generative search summaries reshape discovery beyond blue links.
Each category answers a different question about search performance, and the reason for tracking any of them is the business growth the KPIs make visible.
Why do SEO KPIs matter for business growth?
SEO KPIs matter for business growth because goal-tied KPIs link SEO activity directly to revenue, decision-making, and executive accountability. Organic conversions and customer lifetime value turn SEO from a technical function into a revenue channel that leadership can evaluate, fund, and defend. Resources then flow to the initiatives with proven return instead of to activity for its own sake.
The business impact of the right SEO KPIs extends to competitive positioning and market growth. Companies that measure outcome KPIs identify which SEO initiatives drive the highest return, scale the winners, and move away from underperforming tactics faster. Marketing leaders use the same data to prove SEO's contribution to customer acquisition, market share, and long-term profitability, rather than reporting vanity metrics like total keyword count or raw backlink volume.
Organic search drives 53.3% of all trackable website traffic, according to BrightEdge Research, and a 2026 analysis by First Page Sage found that SEO campaigns yield an average return on investment of 748%, which is why KPI tracking turns SEO from a cost line into a managed growth process. The first link in that chain of measurement is organic traffic itself.
What organic traffic KPIs should you track?
The organic traffic KPIs to track are organic sessions, organic users, new versus returning visitors, engaged sessions, and traffic quality, as detailed below:
- Organic sessions: the total number of visits arriving from organic search results, tracked in Google Analytics 4 under the "Organic Search" channel and the primary indicator of how much traffic search visibility delivers.
- Organic users: the count of distinct individuals visiting via organic search, which separates audience reach from session volume.
- New versus returning visitors: the split between first-time and repeat organic visitors, where a healthy balance shows expanding visibility alongside topical authority that brings readers back.
- Engaged sessions from organic search: sessions lasting longer than 10 seconds, containing a key event, or including at least two pageviews, the GA4 replacement for older session-quality indicators.
- Traffic quality over raw volume: engagement rate, average engagement time, and conversion contribution, which matter more than session growth alone because high-quality organic traffic converts.
Organic traffic KPIs count every search visit, including visits from people who already knew the brand, which is why non-branded traffic gets tracked on its own.
What non-branded SEO traffic should you track?
Non-branded SEO traffic to track is the organic search traffic that arrives from queries containing no company brand name or related terms. Non-branded traffic signals new market reach and genuine demand for content, independent of existing brand recognition. A rising non-branded share over time shows that SEO is expanding the audience rather than harvesting brand demand, so the ratio of non-branded to branded traffic belongs on every organic traffic report.
Non-branded traffic is isolated in Google Search Console by applying a query filter that excludes brand-related terms. The filtered view exposes clicks, impressions, click-through rate (CTR), and average position for non-branded queries over time, which separates the demand SEO created from the demand brand familiarity created. The same Search Console data feeds the search-performance metrics that describe visibility before the click.
What search-performance metrics should you track?
The search-performance metrics to track are impressions, clicks, and average position from Google Search Console, as listed below:
- Impressions: the number of times a website's links appear in search results, a measure of total visibility across Google's index.
- Clicks: the number of times searchers click through to the site from search results, the bridge between visibility and traffic.
- Average position: the mean ranking position of pages for the queries that trigger them, a signal of competitiveness and relevance in search results.
Together, impressions, clicks, and average position show how searchers see and respond to a site in search results, and the ratio of clicks to impressions is the click-through rate.
What SEO click-through rate (CTR) should you track?
The SEO click-through rate (CTR) to track is CTR by query and by position. Organic CTR is the percentage of search impressions that turn into clicks, calculated by dividing clicks by impressions, and CTR shows how well page titles and meta descriptions attract searchers.
Pages with high impressions and low CTR are the biggest optimization opportunities. High-impression, low-CTR pages are visible in search results yet fail to earn the click, which points to weak title tags, weak meta descriptions, or a mismatch with search intent. Comparing CTR against the expected rate for each ranking position exposes the queries where titles and descriptions underperform.
Position-by-position CTR benchmarks set realistic targets. The first organic result draws 39.8% of clicks, the second 18.7%, and the third 10.2%, according to First Page Sage's 2026 report "Google Click-Through Rates (CTRs) by Ranking Position," and the rate keeps falling down the page. Monitoring CTR against position benchmarks guides title and description work, while keyword-visibility KPIs show where those positions come from.
What keyword-visibility KPIs should you track?
The keyword-visibility KPIs to track are tracked keyword rankings, ranking distribution, and visibility share or share of voice, as listed below:
- Tracked keyword rankings: the position of the website for a defined set of target keywords, monitored over time in tools like Ahrefs or Semrush across a portfolio of branded, non-branded commercial, and informational queries.
- Ranking distribution: the spread of tracked keywords across SERP positions, where a strong strategy pushes a growing share into the top three (positions 1 to 3) and onto page one (positions 1 to 10).
- Visibility share or share of voice: the estimated percentage of available clicks the site captures against competitors across the tracked keyword set, weighted by search volume and the CTR expected at each position, which gives a truer picture of search presence than raw rankings.
Keyword-visibility KPIs answer where the site stands in the market, and the first of them, keyword rankings, needs a tracking method that reads distribution rather than single positions.
How should SEO keyword rankings be tracked?
SEO keyword rankings should be tracked as position movement across a predefined keyword set, with the focus on ranking distribution rather than isolated positions. Rank-tracking tools like Ahrefs or Semrush record shifts over time for every keyword in the set. Grouping keywords into bands such as top 3, top 10, and beyond page one gives a clear view of visibility progress.
Distribution bands show whether keywords are climbing into more competitive positions or stalling where adjustments are needed. Ranking distribution rolls up into a single visibility figure, which is what search visibility measurement produces.
How should SEO search visibility be measured?
SEO search visibility should be measured with a visibility percentage and share of voice (SOV). Visibility percentage estimates the share of potential clicks a site could receive across tracked keywords, factoring in search volume and current ranking positions. Share of voice measures a brand's presence in search results against competitors within a defined keyword set, expressed as a percentage that shows dominance within core keyword clusters.
Both measures give a strategic view of market presence that accounts for search volume, position distribution, and competitive context. A rising share of voice inside the most important keyword groups is the target, with the achievable level depending on market competitiveness and business maturity. Visibility explains how many searchers can find the site, and landing-page KPIs explain what those searchers do next.
What landing-page and content-engagement KPIs should you track?
The landing-page and content-engagement KPIs to track are landing-page performance, pageviews, pages per session, and top pages driving organic traffic, as detailed below:
- Landing-page performance: sessions that begin on a given page, shown in the Google Analytics 4 landing page report, which identifies the entry points that capture search traffic.
- Pageviews: the total number of times content is viewed, a popularity indicator that reveals trending topics and seasonal patterns when filtered to organic sources in GA4 engagement reports.
- Pages per session: the depth of a visit, where a higher figure points to strong internal linking and content that invites exploration, and segmenting by landing page shows which entry points lead deeper into the site.
- Top pages driving organic traffic: the pages with the most organic sessions, cross-checked against clicks and impressions in Google Search Console to find the highest-demand topics and the best candidates for optimization.
Landing-page KPIs show which pages attract organic visitors, and user engagement metrics show how those visitors behave once on the page.
What SEO user engagement metrics should you track?
The SEO user engagement metrics to track are average engagement time, time on page, and engaged sessions, the Google Analytics 4 (GA4) metrics that replaced older behavior metrics, as listed below:
- Average engagement time: the average time a user actively interacts with content, which counts active engagement rather than passive open tabs.
- Time on page: an older metric that still shows how long visitors spend on a single page and how well content is consumed.
- Engaged sessions: sessions that last at least 10 seconds, include a key event, or contain multiple pageviews, the measure of interactions that retain visitor interest.
Engagement metrics describe the sessions that held attention, and bounce rate describes the sessions that did not.
What SEO bounce rate should you track?
The SEO bounce rate to track is the Google Analytics 4 (GA4) bounce rate, the percentage of sessions that were not engaged, and bounce rate has shifted from a core metric to a secondary check. Engagement rate has become the preferred metric because engagement rate counts sessions that lasted over 10 seconds, included multiple pageviews, or triggered a key event, and bounce rate is its inverse.
For SEO purposes, engagement rate reflects content value better than bounce rate does. Bounce rate still earns a look when evaluating landing pages for relevance and intent alignment, since a high bounce rate on a high-intent landing page signals a mismatch between the search query and the page content. Engagement is the step before conversion, and conversion KPIs are where organic traffic becomes business outcomes.
What conversion KPIs should you track for SEO?
The conversion KPIs to track for SEO are organic conversions and key events, conversion rate, goal completions, and lead quality with multi-touch attribution, as detailed below:
- Organic conversions and key events: completed actions such as form submissions, demo requests, or purchases that originate from organic search, recorded as key events in Google Analytics 4 so the most common organic actions are visible.
- Conversion rate: the percentage of organic sessions that end in a conversion, calculated by dividing conversions by sessions, which flags high-performing content and optimization opportunities, with dedicated landing pages converting better than blog pages and the achievable rate varying by industry and page type.
- Goal completions: micro conversions such as time-on-page thresholds, scroll depth, and video views, which show engagement and content effectiveness even when the final conversion action is not completed.
- Lead quality and multi-touch attribution: lead-to-opportunity conversion rate and sales-qualified lead percentage, plus attribution models that reveal how organic search initiates and nurtures prospects across the buying cycle.
Conversion KPIs supply the numerator for the revenue and profitability KPIs that follow: organic revenue, SEO ROI, and customer lifetime value.
What revenue and profitability KPIs should you track for SEO?
The revenue and profitability KPIs to track for SEO are SEO return on investment, organic revenue, cost per acquisition, and customer lifetime value, as detailed below:
- SEO return on investment (ROI): the revenue generated from organic search compared against the total SEO investment, including tools, content, and agency fees, where a positive ROI shows that SEO is cost-effective and profitable.
- Organic revenue: the sales attributed to organic search traffic, measured in Google Analytics 4 by attributing transactions to the organic search channel, which puts a monetary value on organic visitors.
- Cost per acquisition (CPA): the total SEO investment divided by the number of customers acquired through organic channels, where a lower CPA than other marketing channels proves SEO is the more efficient acquisition route.
- Customer lifetime value (CLV): the total revenue expected from a customer acquired through organic search over the relationship, which captures the long-term value of high-intent organic visitors.
Revenue KPIs show what SEO earns, and technical SEO KPIs protect the site conditions that make earning possible.
What technical SEO and Core Web Vitals KPIs should you track?
The technical SEO and Core Web Vitals KPIs to track are Largest Contentful Paint, Interaction to Next Paint, Cumulative Layout Shift, page speed, crawlability and crawl errors, and site health score, as listed below:
- Largest Contentful Paint (LCP): loading performance, with a good score under 2.5 seconds, which governs how quickly users see the main content.
- Interaction to Next Paint (INP): interactivity and responsiveness, with a good score under 200 milliseconds so users feel no delay when interacting with the page.
- Cumulative Layout Shift (CLS): visual stability, with a good score below 0.1 so unexpected layout shifts do not disrupt engagement.
- Page speed: total load time, where 53% of mobile visits are abandoned when a page takes longer than 3 seconds to load, according to Google's Think with Google research "The Need for Mobile Speed" (2016).
- Crawlability and crawl errors: whether search engines can reach and index the site, with crawl error monitoring exposing technical issues that block visibility.
- Site health score: a composite metric from crawling tools that reflects crawlability, indexability, and mobile responsiveness together.
Technical KPIs keep the site fast, stable, and reachable, and the indexed page count is the technical KPI that confirms Google holds the pages at all.
How should SEO indexed pages be tracked?
SEO indexed pages should be tracked in Google Search Console's Page indexing report (once named the Index Coverage report). The report gives the total count of pages Google has crawled and indexed, and the raw count alone says little about SEO health. The indexed total needs comparison against the number of pages that actually drive organic traffic.
A healthy indexation strategy keeps the indexed pages aligned with the pages intended for indexing, avoiding both under-indexation and over-indexation. Under-indexation leaves revenue-driving pages out of search results, while over-indexation lets low-quality or duplicate pages in and dilutes site authority. Monitoring the traffic-driving subset alongside the indexed total exposes index bloat and crawl waste, and the pages that do earn traffic depend on the backlink authority KPIs that follow.
What backlink authority KPIs should you track?
The backlink authority KPIs to track are backlink volume, backlink quality, new backlinks, and referring-domain growth, as listed below:
- Backlink volume: the total number of inbound links pointing to the site, a measure of reach and potential influence on search engines.
- Backlink quality: the relevance, trustworthiness, and editorial value of the linking page and domain, where a few authoritative links outweigh many low-quality ones.
- New backlinks: links acquired over a set period, which gauge link-building momentum.
- Referring-domain growth: the number of distinct external domains linking to the site, a stronger authority indicator than raw backlink totals because referring domains reflect diversity and wider recognition.
Backlink authority KPIs describe the link profile, and tracking them requires a method that watches backlinks and referring domains together.
How should SEO backlinks and referring domains be tracked?
SEO backlinks and referring domains should be tracked by monitoring total backlinks, new backlinks, and referring-domain count together, so quantity and quality of links are assessed over time. The link metrics to monitor are listed below:
- Total backlinks: the cumulative number of backlinks, the baseline for total link volume.
- New backlinks: links acquired in the latest period, a read on recent link-building success and fresh opportunities.
- Referring domains: the distinct websites linking to the site, where links from many domains beat multiple links from the same source.
- Link quality: the authority and relevance of linking domains, where authoritative sites carry more SEO value than many weak ones.
- Lost links: links that disappeared, which flag issues to address and backlinks worth recovering.
Tools like Ahrefs, Semrush, or Moz report all five link metrics, and each tool then reduces the link profile to an authority score that needs its own tracking method.
How should SEO domain authority (DR, DA, AS) be tracked?
SEO domain authority (DR, DA, AS) should be tracked as a directional trend rather than an absolute score. Domain Rating (DR) from Ahrefs, Domain Authority (DA) from Moz, and Authority Score (AS) from Semrush are third-party metrics that estimate backlink strength and ranking potential, and the three scores differ because each tool uses its own data sources and algorithm. The scores are only comparable as a trend over time for the same site.
Ahrefs Domain Rating is based on the strength of the backlink profile, and recording DR over time reveals gradual changes and link-building problems. Moz Domain Authority is a predictive ranking score derived from the Moz link index and machine-learning signals, useful for comparing authority against competitors over time. Semrush Authority Score combines backlink data with estimated organic traffic and spam factors, which makes AS a read on the combined health of the link strategy.
Consistent tracking looks for a gradual upward trend and ignores small fluctuations, which tend to come from changes in the provider's algorithm rather than from the site. Domain authority is one signal among many for the long-term health of a link strategy, and SERP visibility metrics measure the presence that authority is supposed to buy.
What SERP visibility metrics should you track, including Google Business Profile performance?
The SERP visibility metrics to track, including Google Business Profile performance, are SERP feature and rich-result presence, local pack rankings, Google Business Profile metrics, and AI Overview visibility, as listed below:
- SERP feature and rich-result presence: whether content appears in featured snippets, People Also Ask boxes, knowledge panels, and other rich results, placements that capture attention and traffic.
- Local pack rankings: position within Google's local pack, the three business listings shown beside map results, which matters for businesses targeting geographic keywords.
- Google Business Profile metrics: views, calls, and direction requests on the profile, which reflect local visibility and the quality of traffic the profile attracts for businesses that depend on local foot traffic.
- AI Overview visibility: citations and mentions inside Google's AI-generated search summaries as of 2026, a signal that content is treated as a trusted source for AI responses.
SERP visibility metrics complete the picture of organic and local presence, and which of all the KPIs matter most depends on who is reading the report.
Who needs different SEO KPIs, and how should they be segmented?
Different SEO KPIs are needed by different business types and organizational roles, and KPIs should be segmented by both. Small and medium-sized businesses (SMBs) focus on local visibility, conversion rate, and cost per acquisition because SMBs must prove ROI fast with lean resources. Local businesses prioritize Google Business Profile views, calls, and direction requests alongside local pack rankings and branded impressions that reflect community trust.
E-commerce operations concentrate on organic revenue, product page rankings, organic conversion rate, and customer lifetime value because e-commerce success is transactional. SaaS companies prioritize engaged sessions, non-branded organic traffic that signals genuine demand, and multi-touch attribution that fits longer sales cycles. Enterprise organizations track share of voice across markets and verticals, segment performance by business unit or region, and prioritize business-outcome KPIs over vanity metrics.
Segmentation by role follows the same logic. Executive stakeholders need the summit metrics of SEO ROI, organic revenue, customer lifetime value, and share of voice, marketing managers need the operational view of traffic trends, keyword visibility, conversion rates, engagement, and Core Web Vitals, and SEO specialists and agencies need granular data such as CTR by query and position, indexed pages, crawl errors, backlink growth, and SERP feature presence.
Segmentation sets the reporting rhythm, with executive dashboards refreshing monthly or quarterly and operational teams reviewing weekly. Executives get relevance without overload, practitioners get the detail they need, and enterprise teams need the most demanding segmentation of all.
Which SEO performance metrics matter for enterprise success?
The SEO performance metrics that matter for enterprise success are share of voice, segmentation by market and vertical, and business-outcome KPIs. Share of voice measures brand visibility against competitors across a defined keyword set and shows how much of the market's organic opportunity the enterprise captures, which guides strategic adjustments in marketing effort.
Segmentation by market and vertical is required because enterprises operate across regions and product lines, and each segment needs SEO tied to its own business goals. Business-outcome KPIs such as revenue, conversions, and customer acquisition cost then demonstrate the direct impact of SEO on the enterprise bottom line. Enterprise metrics, like every other KPI set, only work on a review schedule that respects how slowly SEO moves.
How often should SEO KPIs and metrics be reviewed?
SEO KPIs and metrics should be reviewed monthly, with quarterly benchmarking on top. A monthly reporting cadence supplies enough data to see trends without overreacting to short-term fluctuations, and monthly review keeps progress tracking consistent against the long-term trajectory. Quarterly benchmarking then evaluates performance against targets, compares year-over-year growth, and informs resource allocation and strategy adjustments.
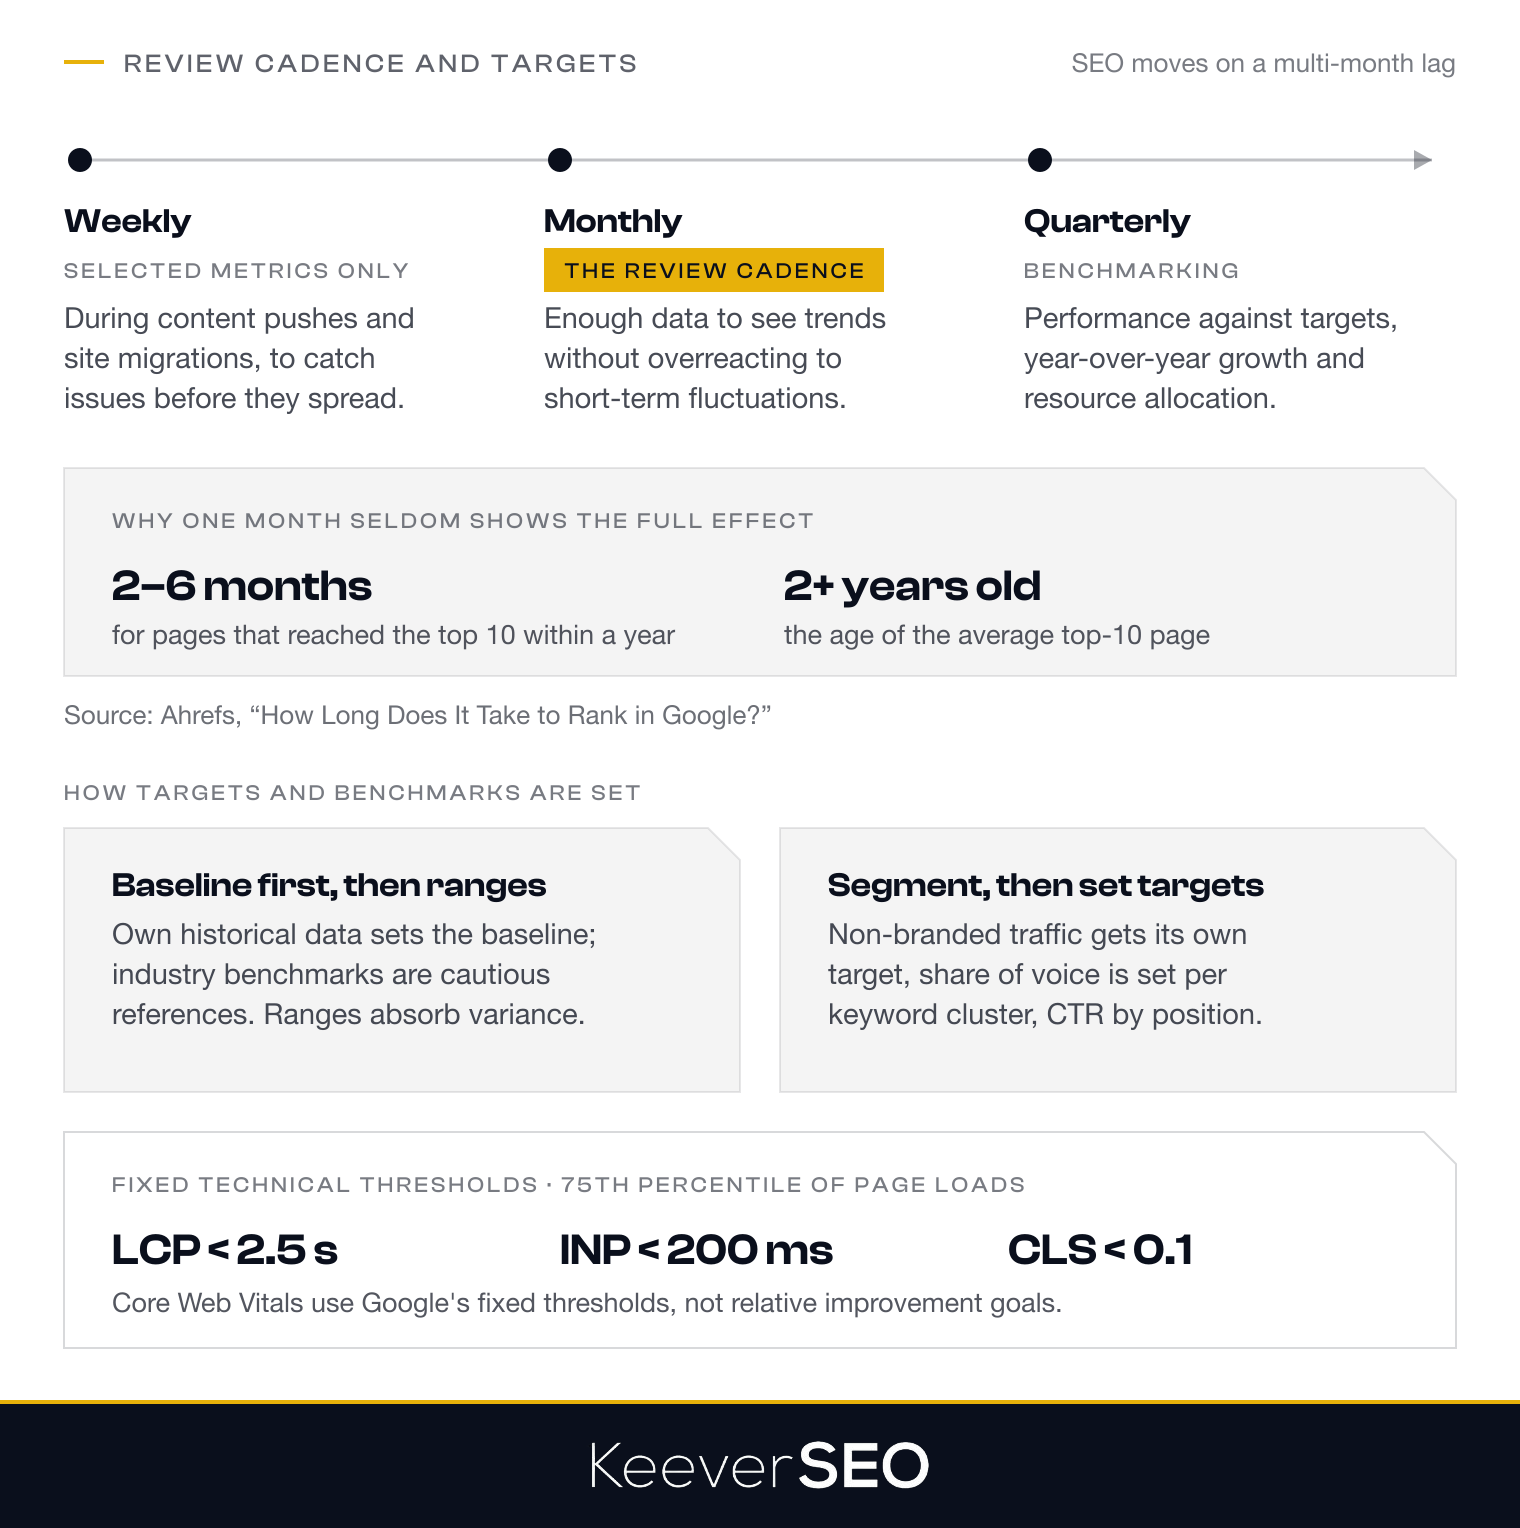
The quarterly view matters because SEO operates on a multi-month lag before changes show in the data. Ahrefs' study "How Long Does It Take to Rank in Google?" found that the pages that reached the top 10 within a year took two to six months to get there, and that the average top-10 page was more than two years old, so a single month of data seldom captures the full effect of an SEO change.
Review frequency shifts with business type and campaign intensity. Active content pushes and site migrations justify weekly monitoring of selected metrics to catch issues before they spread, while established sites with stable performance rely on monthly and quarterly reviews. Patience prevents premature course corrections on insufficient data, and the review cadence only has meaning once targets and benchmarks define what good looks like.
How should SEO targets and benchmarks be set?
SEO targets and benchmarks should be set from the site's own historical data first. Historical performance gives a baseline that reflects the industry, the business maturity, and the seasonality of the site. When historical data is thin, industry benchmarks fill the gap, but industry averages deserve caution because a rate that is normal in one sector may be unreachable in another.
Targets should be ranges, not single numbers, because SEO results fluctuate with seasonality, algorithm updates, competitive activity, and the multi-month lag. A target range for organic traffic growth might widen during an active content push and narrow in a quiet quarter, and a target for referring domains might be expressed as a monthly band rather than one figure. Ranges absorb normal variance without hiding real decline.
Segmentation comes before any target is assigned. Different pages, keyword clusters, and traffic sources need distinct benchmarks: non-branded traffic gets its own growth target separate from branded traffic, share of voice is set per core keyword cluster, CTR targets vary by ranking position, and Core Web Vitals use fixed technical thresholds of LCP under 2.5 seconds, INP under 200 milliseconds, and CLS under 0.1, measured at the 75th percentile of page loads per Google's "Web Vitals" guidance on web.dev, rather than relative improvement goals. Targets built this way are only as trustworthy as the data behind them, which is why KPI data needs validation.
How should SEO KPI data be validated?
SEO KPI data should be validated by reconciling the discrepancies between Google Analytics 4 (GA4) and Google Search Console. The two platforms measure different things: GA4 records on-site sessions, while Google Search Console records search-result clicks. Validation starts by comparing trends over the same date range and landing pages to confirm that clicks, sessions, and conversions move together logically.
Discrepancies arise from session definitions, tracking blockers, and attribution rules. Unusual gaps call for an audit of implementation issues, bot filtering, and mismatched channel attribution. Conversion and revenue KPIs are validated by confirming that GA4 key events are configured and that conversion counts match CRM or transaction records.
Validated KPI data then belongs in a dashboard that shows the source of every number and the relationships between traffic, visibility, conversions, and revenue.
What should an SEO KPI dashboard include?
An SEO KPI dashboard should include a dedicated widget and data source for each KPI category, as listed below:
- Traffic widgets: organic sessions, users, new versus returning visitors, and engaged sessions from Google Analytics 4, split into branded and non-branded segments.
- Search visibility widgets: impressions, clicks, average position, and CTR by query and page from Google Search Console, plus tracked keyword rankings and ranking distribution from Ahrefs or Semrush.
- Conversion and revenue widgets: organic conversions, key events, conversion rate, and goal completions connected to organic revenue, SEO ROI, cost per acquisition, and customer lifetime value.
- Technical health widgets: Core Web Vitals (LCP, INP, CLS), indexed page count, crawl errors, and site health scores from Google Search Console and crawling tools.
- Backlink authority widgets: total backlinks, new backlinks, referring-domain count, and authority scores from Ahrefs, Moz, or Semrush.
- SERP and local visibility widgets: SERP feature presence, rich-result eligibility, local pack rankings, and Google Business Profile metrics for businesses that depend on local search.
A single dashboard built from the six widget groups connects SEO performance to business outcomes, and the same dashboard is the raw material from which a provider reports and explains KPI changes.
How should an SEO provider report KPI performance and explain changes?
An SEO provider should report KPI performance with context and causation, not raw numbers alone. Good reporting explains why a metric moved: whether a traffic increase came from new content, improved rankings, or seasonality, and whether a rankings drop came from an algorithm update, new competition, or a technical fault. A dashboard without narrative leaves stakeholders without a basis to judge decisions or the value of the SEO investment.
Reports should tie every metric movement to named SEO activities, external factors like algorithm changes, and business impact, so that the actions behind results and the areas needing attention are both clear. The best providers frame KPI movements for each stakeholder: executives see how organic growth translates to revenue and ROI, while marketing teams see keyword visibility gains and content performance.
Segmented reporting compares branded against non-branded traffic, breaks conversions down by landing page or content type, and shows competitive position through share of voice. Negative trends arrive with a diagnosis and recommended actions rather than a bare decline, which turns reporting from a backward-looking data dump into a tool for ongoing optimization and accountability. Reporting of that standard is the first thing to expect from an SEO agency.
What should you expect from an SEO agency?
You should expect transparent outcome reporting, ownership of results, and direct dashboard access from an SEO agency. A reputable agency delivers reports that link SEO activity to business outcomes such as revenue, conversions, and market position, with the focus on goal-tied KPIs like organic conversion rate, non-branded traffic growth, and revenue attributed to SEO.
Ownership of results means the agency stands behind the KPIs the agency committed to and explains every fluctuation with context and causation, including whether a change came from an algorithm update, seasonality, or a technical issue, and what corrective action follows. Dashboard access means real-time, self-serve access to Google Analytics 4 and Google Search Console data, so the client can verify reported numbers and monitor progress independently. Transparent reporting, ownership, and dashboard access become the checklist for hiring an agency that reports outcomes.
How do you hire an SEO agency that reports outcomes?
You hire an SEO agency that reports outcomes by vetting the agency's KPI reporting, confirming dashboard access, and verifying the attribution methodology. Vetting starts with sample reports from current or past clients, reviewed for context and causation rather than bare numbers and for a clear link between SEO activity and goal-tied KPIs like organic conversions and non-branded traffic growth.
Dashboard access and data transparency come next. The agency should offer real-time, self-serve access to an SEO dashboard connected to Google Analytics 4 and Google Search Console, so performance can be validated at any time. Our SEO reporting agency provides that level of access together with regular, contextualized reporting.
Attribution methodology is the final check. Ask how the agency tracks and attributes conversions from organic search across multi-touch customer journeys, how the agency reconciles discrepancies between GA4 and Search Console, and how the agency separates branded from non-branded performance. The reporting, dashboard, and attribution checks lead to the KPI reporting questions worth asking before signing.
Which KPI reporting questions should you ask an SEO agency?
The KPI reporting questions to ask an SEO agency are listed below:
- Which KPIs do you report? The answer should name goal-tied outcome KPIs such as organic traffic, keyword visibility, conversions, and revenue.
- What is the reporting cadence? The answer should state whether reports arrive weekly, monthly, or quarterly.
- How do you attribute results? The answer should explain how conversions and revenue are attributed across multiple touchpoints.
- Do you provide dashboard access? The answer should confirm real-time, self-serve access to a KPI dashboard with transparent data sources.
- How do you explain KPI changes? The answer should describe how KPI movements are communicated, including root-cause analysis and recommended actions.
The dashboard question deserves a section of its own, because dashboard access is the difference between reading a report and verifying one.
What SEO dashboard access should an agency provide?
An SEO agency should provide real-time, self-serve dashboard access with per-KPI visibility. Self-serve access lets clients see each key performance indicator directly, which keeps reporting transparent and the agency accountable. The dashboard must draw on transparent data sources such as Google Analytics 4 and Google Search Console so clients can verify reported numbers independently.
We offer per-KPI visibility of that kind. Clients drill into organic traffic, keyword rankings, and other metrics without waiting for a monthly report, and dashboard access is one of the criteria for assessing an agency's KPI reporting as a whole.
How can you assess an SEO agency’s KPI reporting?
You can assess an SEO agency's KPI reporting by checking whether the reporting focuses on outcome KPIs rather than vanity metrics. Strong reporting supplies context and causation for changes in organic conversions, revenue, and visibility. Our reports, for example, connect SEO activity to business results so that performance changes make sense to stakeholders.
Three tests settle the assessment: whether the agency tracks goal-tied KPIs, whether the agency explains changes with context, and whether the agency separates business outcomes from diagnostic data. A reporting system that passes all three shows how SEO effort links to leads, revenue, or other measurable results, and after hiring, the client keeps tracking the same core KPIs to confirm the link holds.
Which SEO KPIs and metrics should you track after hiring an agency?
The SEO KPIs and metrics to track after hiring an agency are the goal-tied core of organic traffic, keyword visibility, conversions, revenue and profitability, and technical health, as listed below:
- Organic traffic: organic sessions, users, new versus returning visitors, and traffic quality, which show whether the agency's work attracts and retains visitors.
- Keyword visibility: rankings for target keywords, ranking distribution, and visibility share against competitors, which show how content performs in search results relative to rivals.
- Conversions: organic conversions, key events, conversion rate, goal completions, and lead quality, which show how organic traffic turns into business results.
- Revenue and profitability: organic revenue, SEO ROI, cost per acquisition, and customer lifetime value, which show the financial impact of the agency's SEO work.
- Technical health: Core Web Vitals, crawlability, crawl errors, indexed pages, and site health, which protect search visibility and user experience.
Tracking the same five categories before and after hiring keeps agency accountability tied to the most important SEO KPIs and metrics, the ones that measure business growth rather than activity.